“Squint your eyes to see clearly, blur reality to make it real.”
Google, Facebook, Amazon. How frequent is your daily interaction with them?
Google’s ads are almost impossible to miss unless you’re using an ad blocker, and virtually any question you have or research you’re working on begins by visiting google.com. Gmail is also widely popular, and even if you’re not using it yourself, chances are that the person you’re in correspondence with does, thus making your e-mails land on Google’s servers Google Has Most of My Email Because It Has All of Yours, Benjamin Mako Hill, 2014. .
Facebook’s social network dominance is obvious – it has more than two billion active users Number of monthly active Facebook users worldwide as of 2nd quarter 2018, Statista. , dwarfing Twitter which has “only” a quarter billion. Instagram has around a billion users, but guess what, Facebook bought Instagram in 2012. Facebook’s social graph is the biggest and most accurate map of human relationships in existence, and it’s privately owned by a corporate entity. Further, Facebook’s “Like” button is tracking your web browsing activities simply by the virtue of being placed on a web page you’re visiting You Probably Don’t Know All the Ways Facebook Tracks You, David Nield, Gizmodo, 2017. .
It’s easy to overlook Amazon’s omnipresence on the web, since to most people Amazon is – oversimplification warning – a webshop. What doesn’t catch the eye of non-technical people is their Amazon Web Services offering, which is providing more than 40% of all cloud-based hosting in the world Cloud Market in 2018 and Predictions for 2021, Sky High Networks. . So chances are that the website you’re looking at in that other tab is running on Amazon’s network of servers.
Graphs
At the heart of all these mechanisms are graphs.
Google has its PageRank algorithm, which works by counting the number and quality of links to a page to determine a rough estimate of how important the website is. PageRank is single-handedly responsible for Google’s web search dominance, which in turn allowed it to dominate the advertising industry. At the time of writing, Google is indexing more than 46 billion pages An estimate from The size of the World Wide Web (The Internet). , each of them a node in the PageRank graph.
Facebook’s beating heart is its social graph, mapping friendships and interactions among the – I’ll say it again – two billion people using it. The amount of personal data in that graph is mind-boggling.
Amazon’s AWS infrastructure comprises a more technical graph – it maps machines instead of people. In order to provide a wide range of customized web service offerings, it has to be scalable and able to adapt to sudden changes in demand. A graph which comprises more than 40% of the global web hosting business is pretty big.
All of these graphs are running behind closed doors, feeding off of data we’re generating, often times involuntarily. As you can see by now, opting out is not an option since you’re using these mechanisms whether you want to or not. It’s drive-by usage, if you will – you’re touching the mechanism(s) while attempting to perform some other task.
So, what can we do? In terms of limiting our footprint in their databases, not much. But can we create a graph of our own, mapping out the topologies of these companies in some way? Can we let them know we see them as well?
Yes, we can.
The Gaze
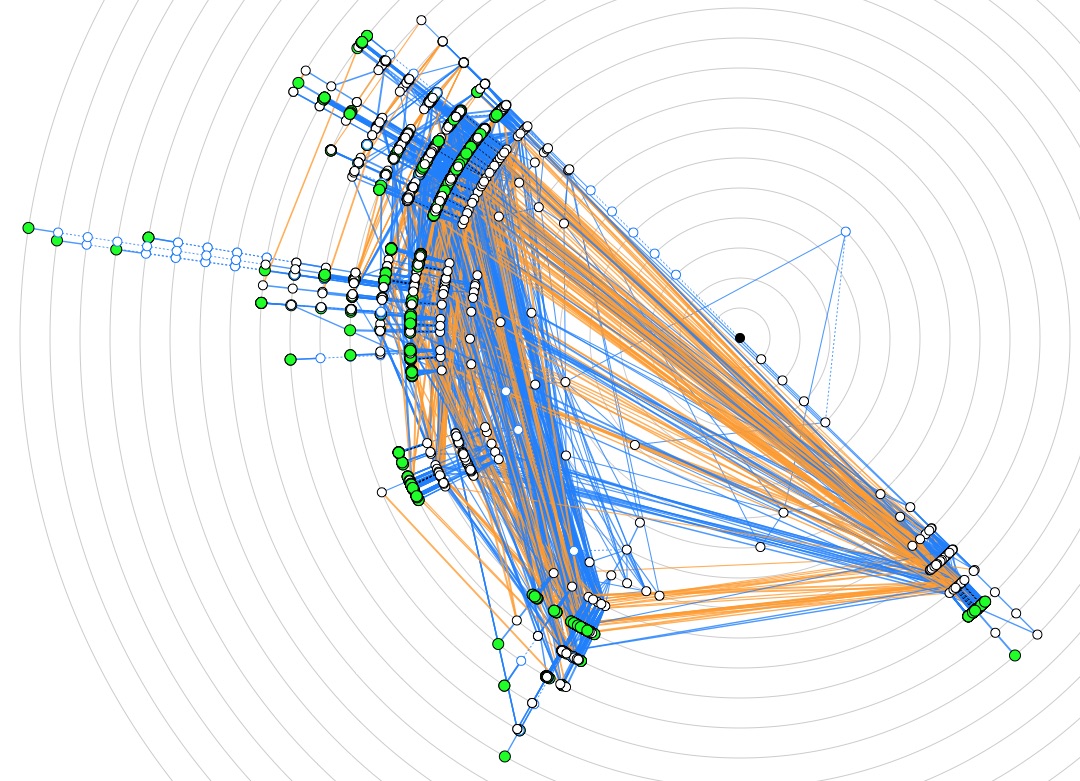
At the core of the Internet, there’s a routing graph. It is a mapping of connections between network servers, describing all the different paths network packets can take on their way to the given destination – the Internet would not exist without it The Internet: Packets, Routing & Reliability, Code.org on Youtube. . So, even though this trio of companies relies on proprietary infrastructures, they have to use this public graph, just like the rest of us.
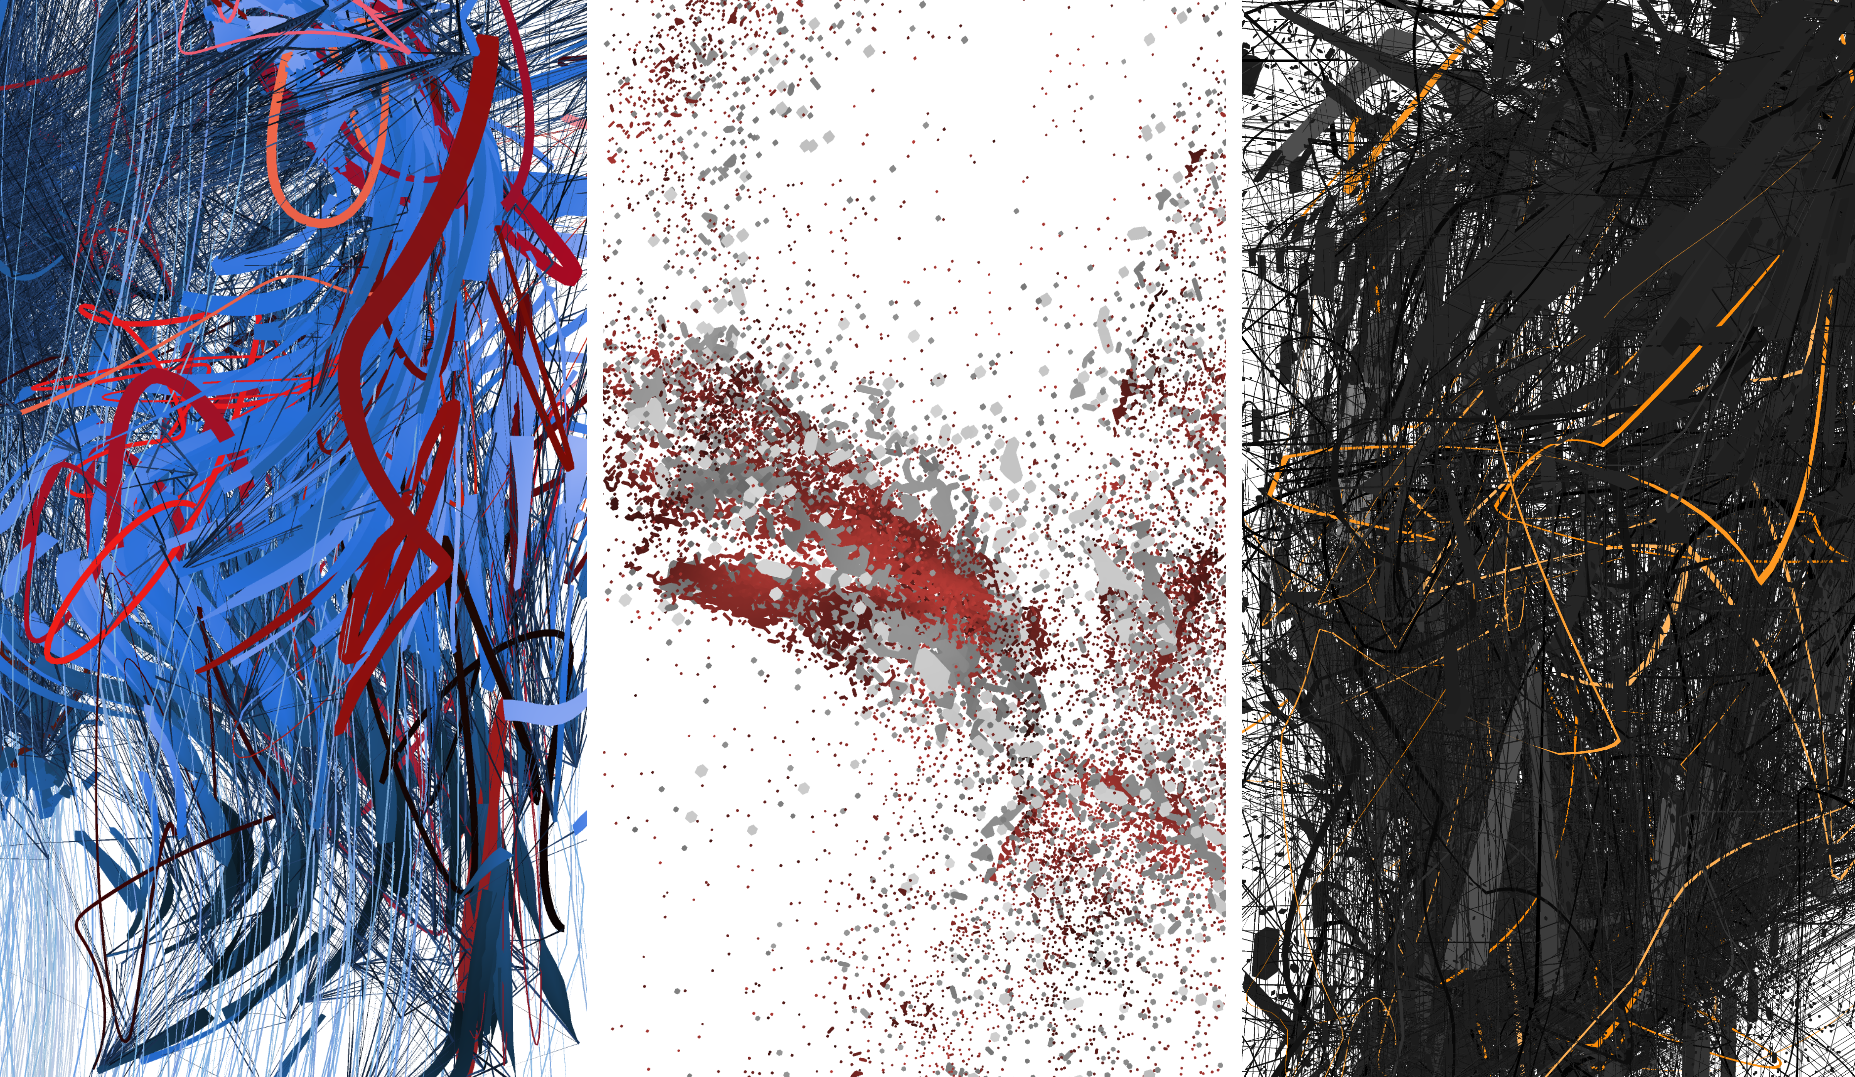
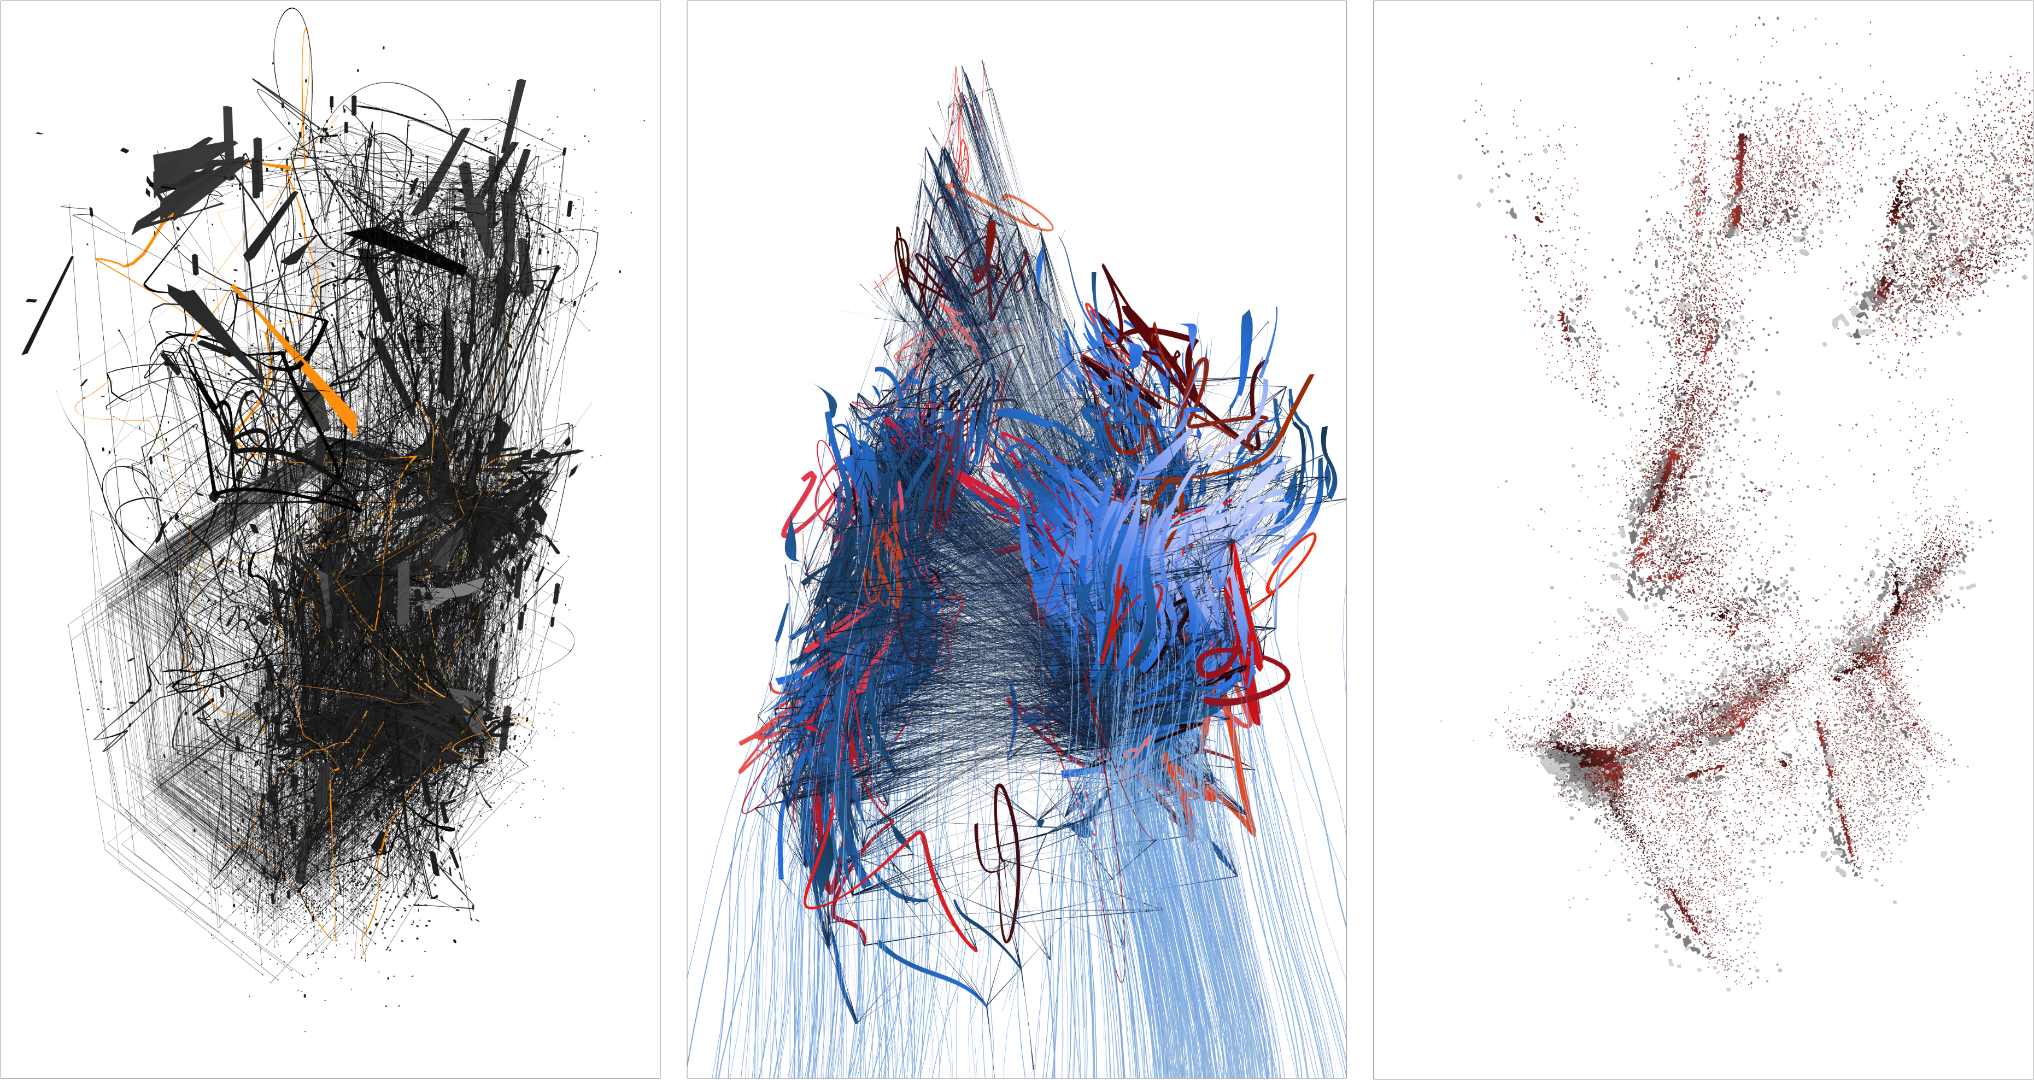
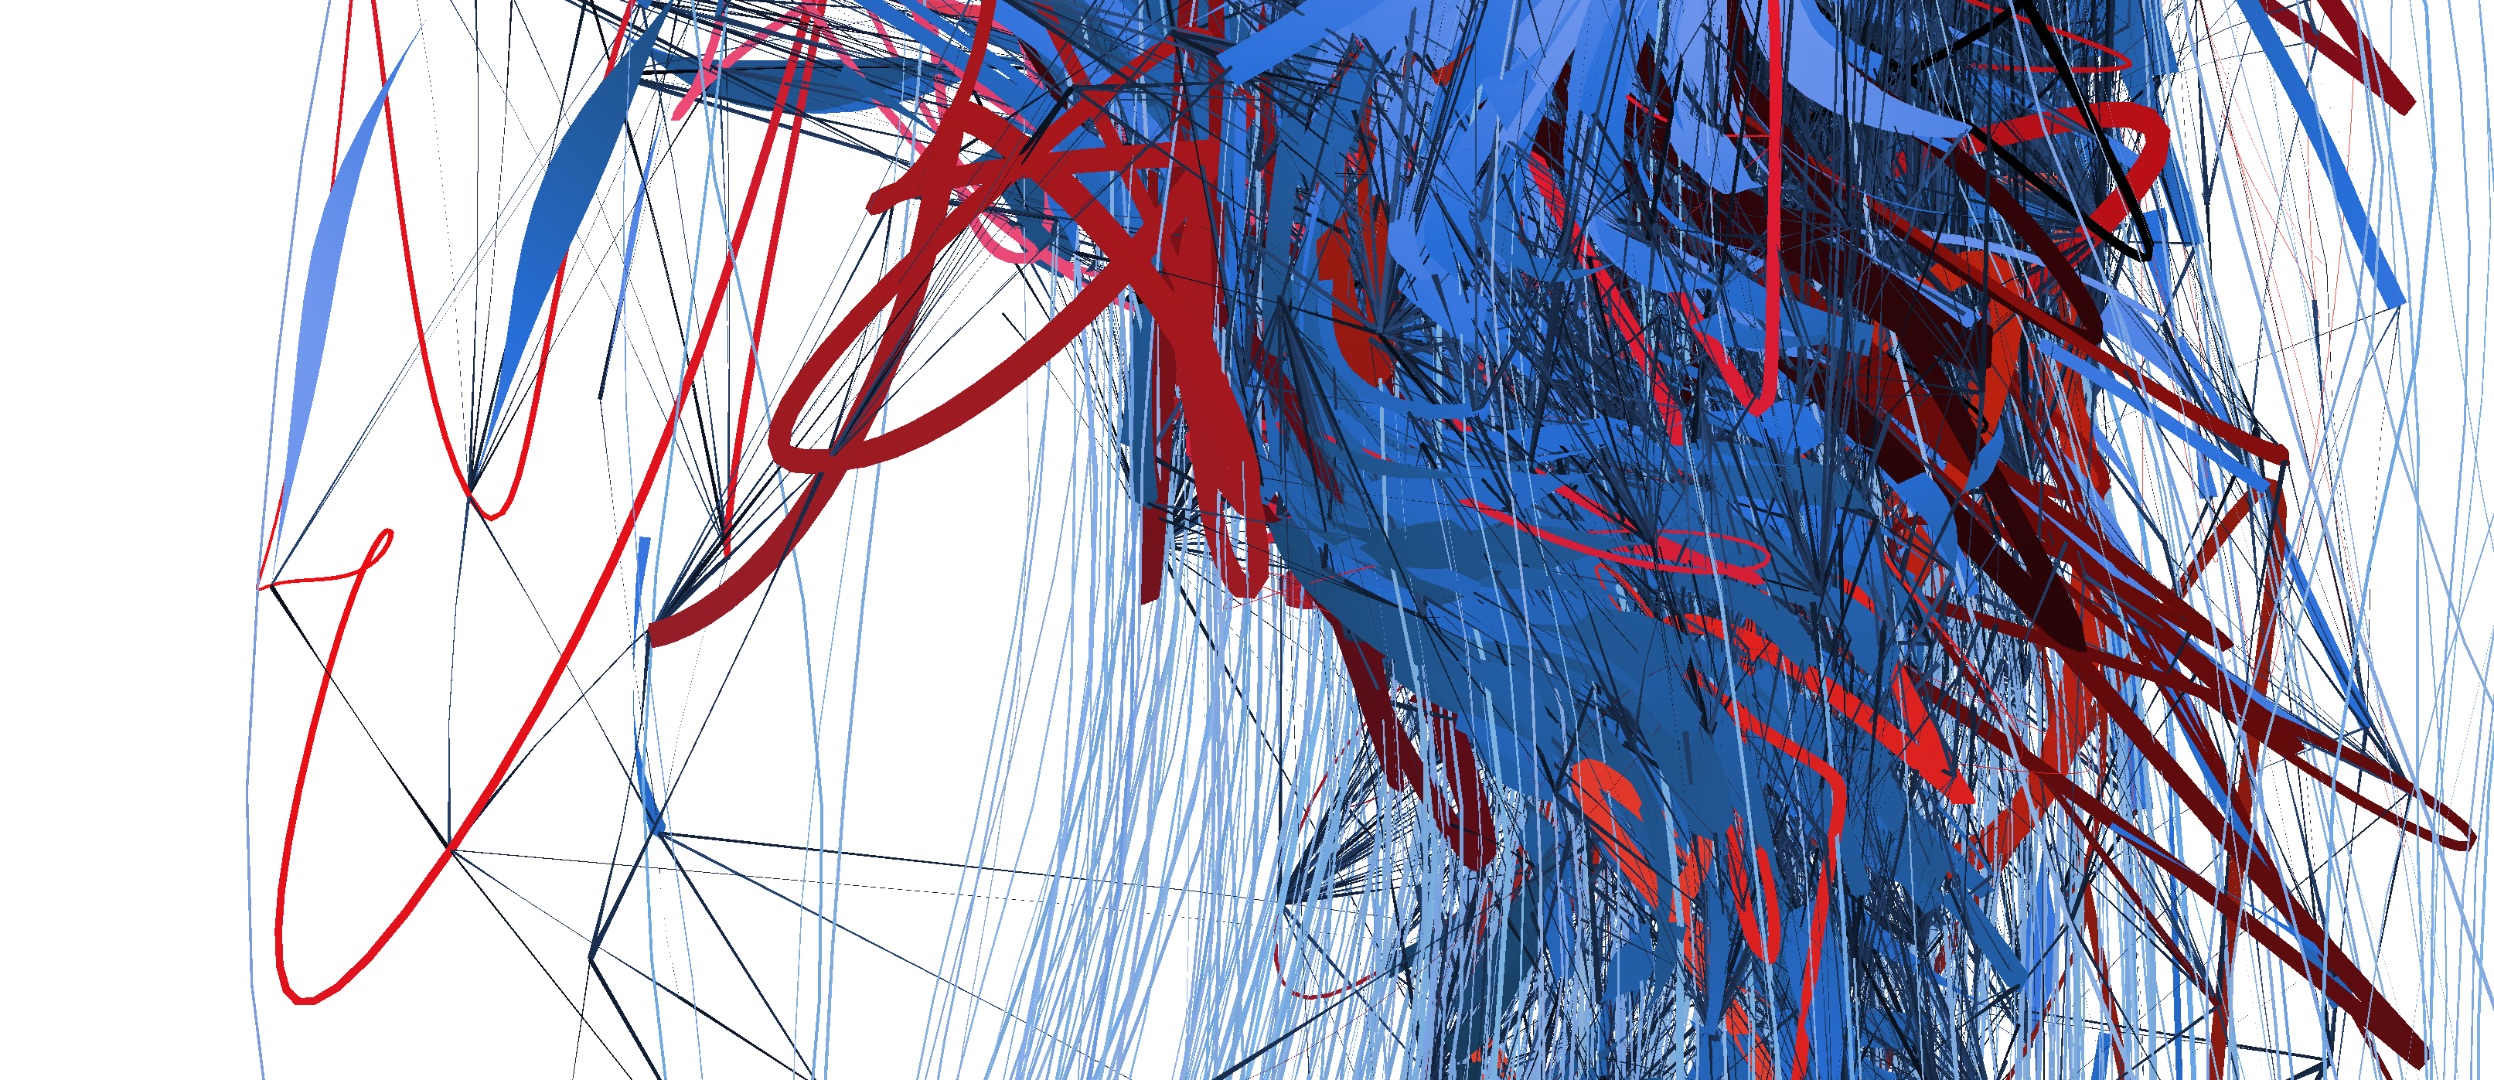
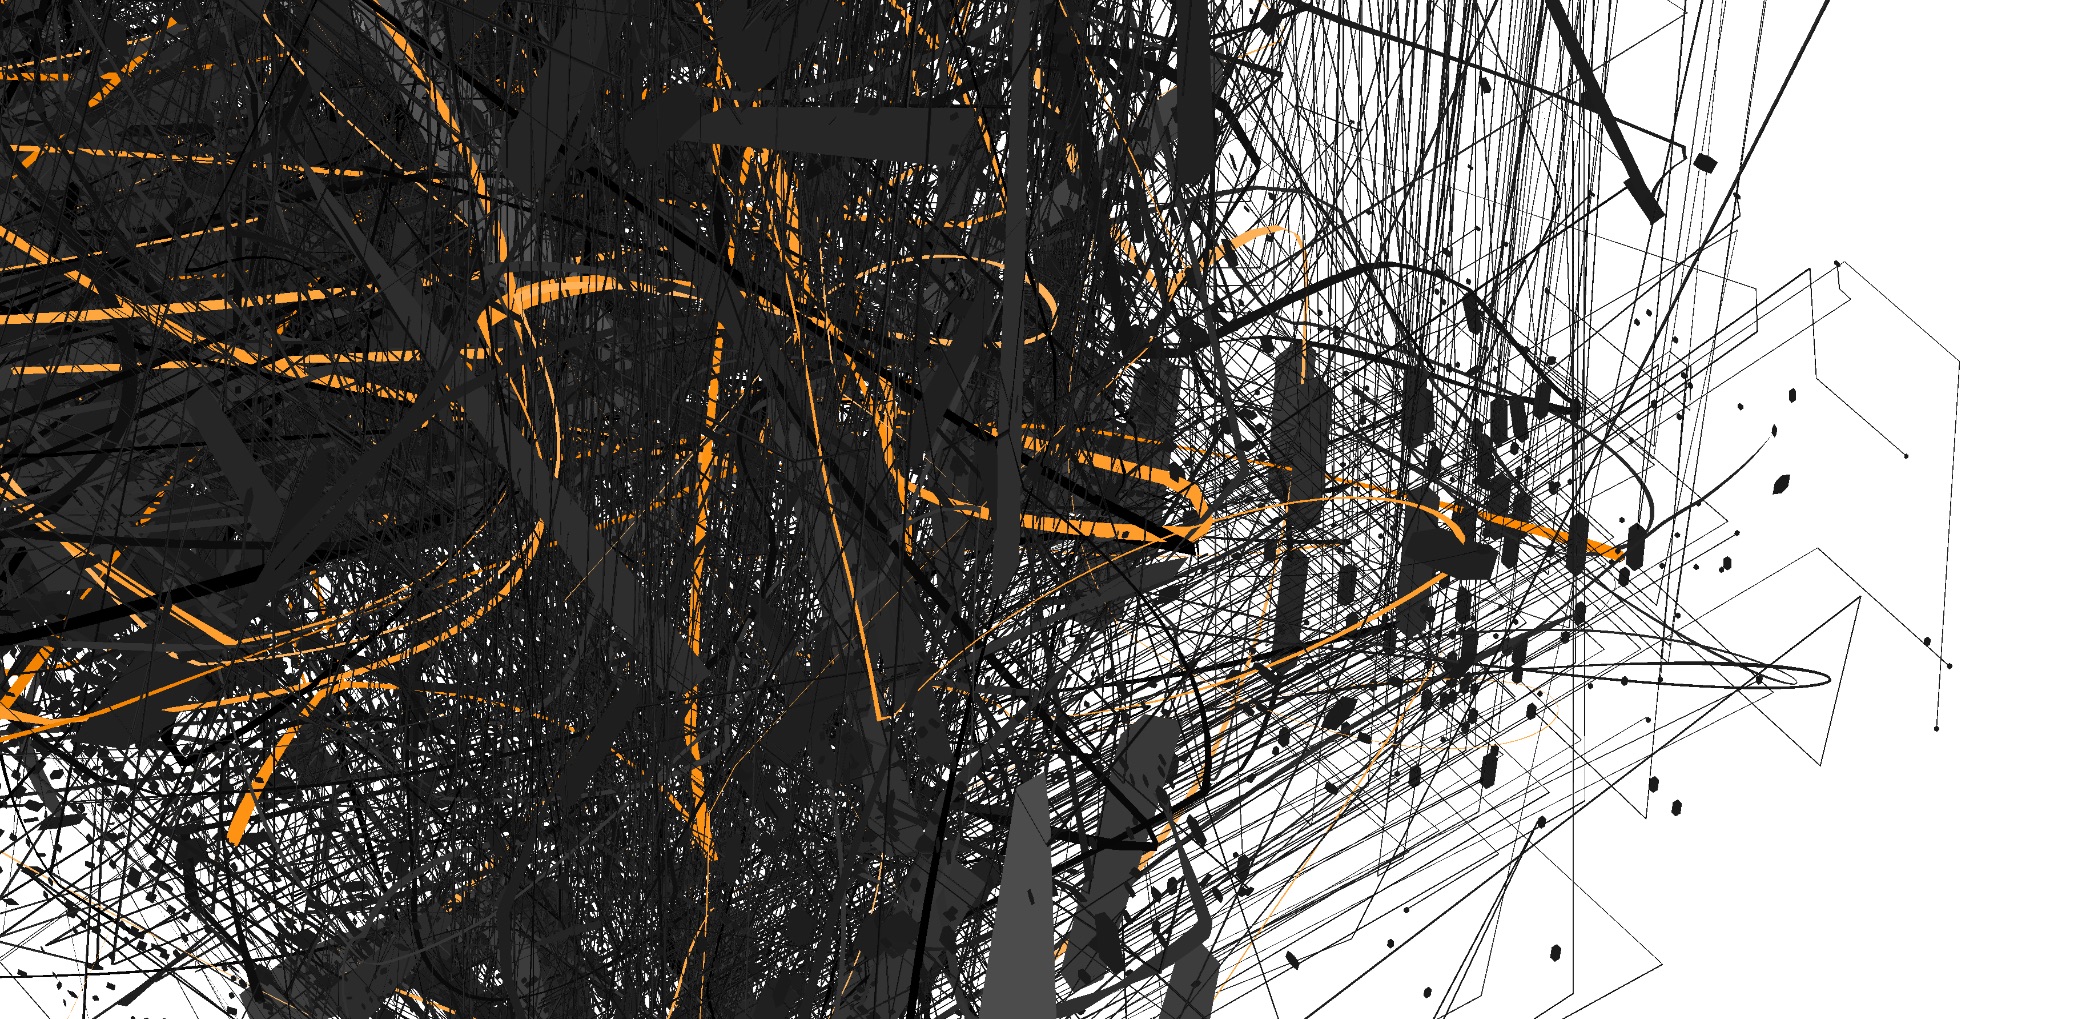
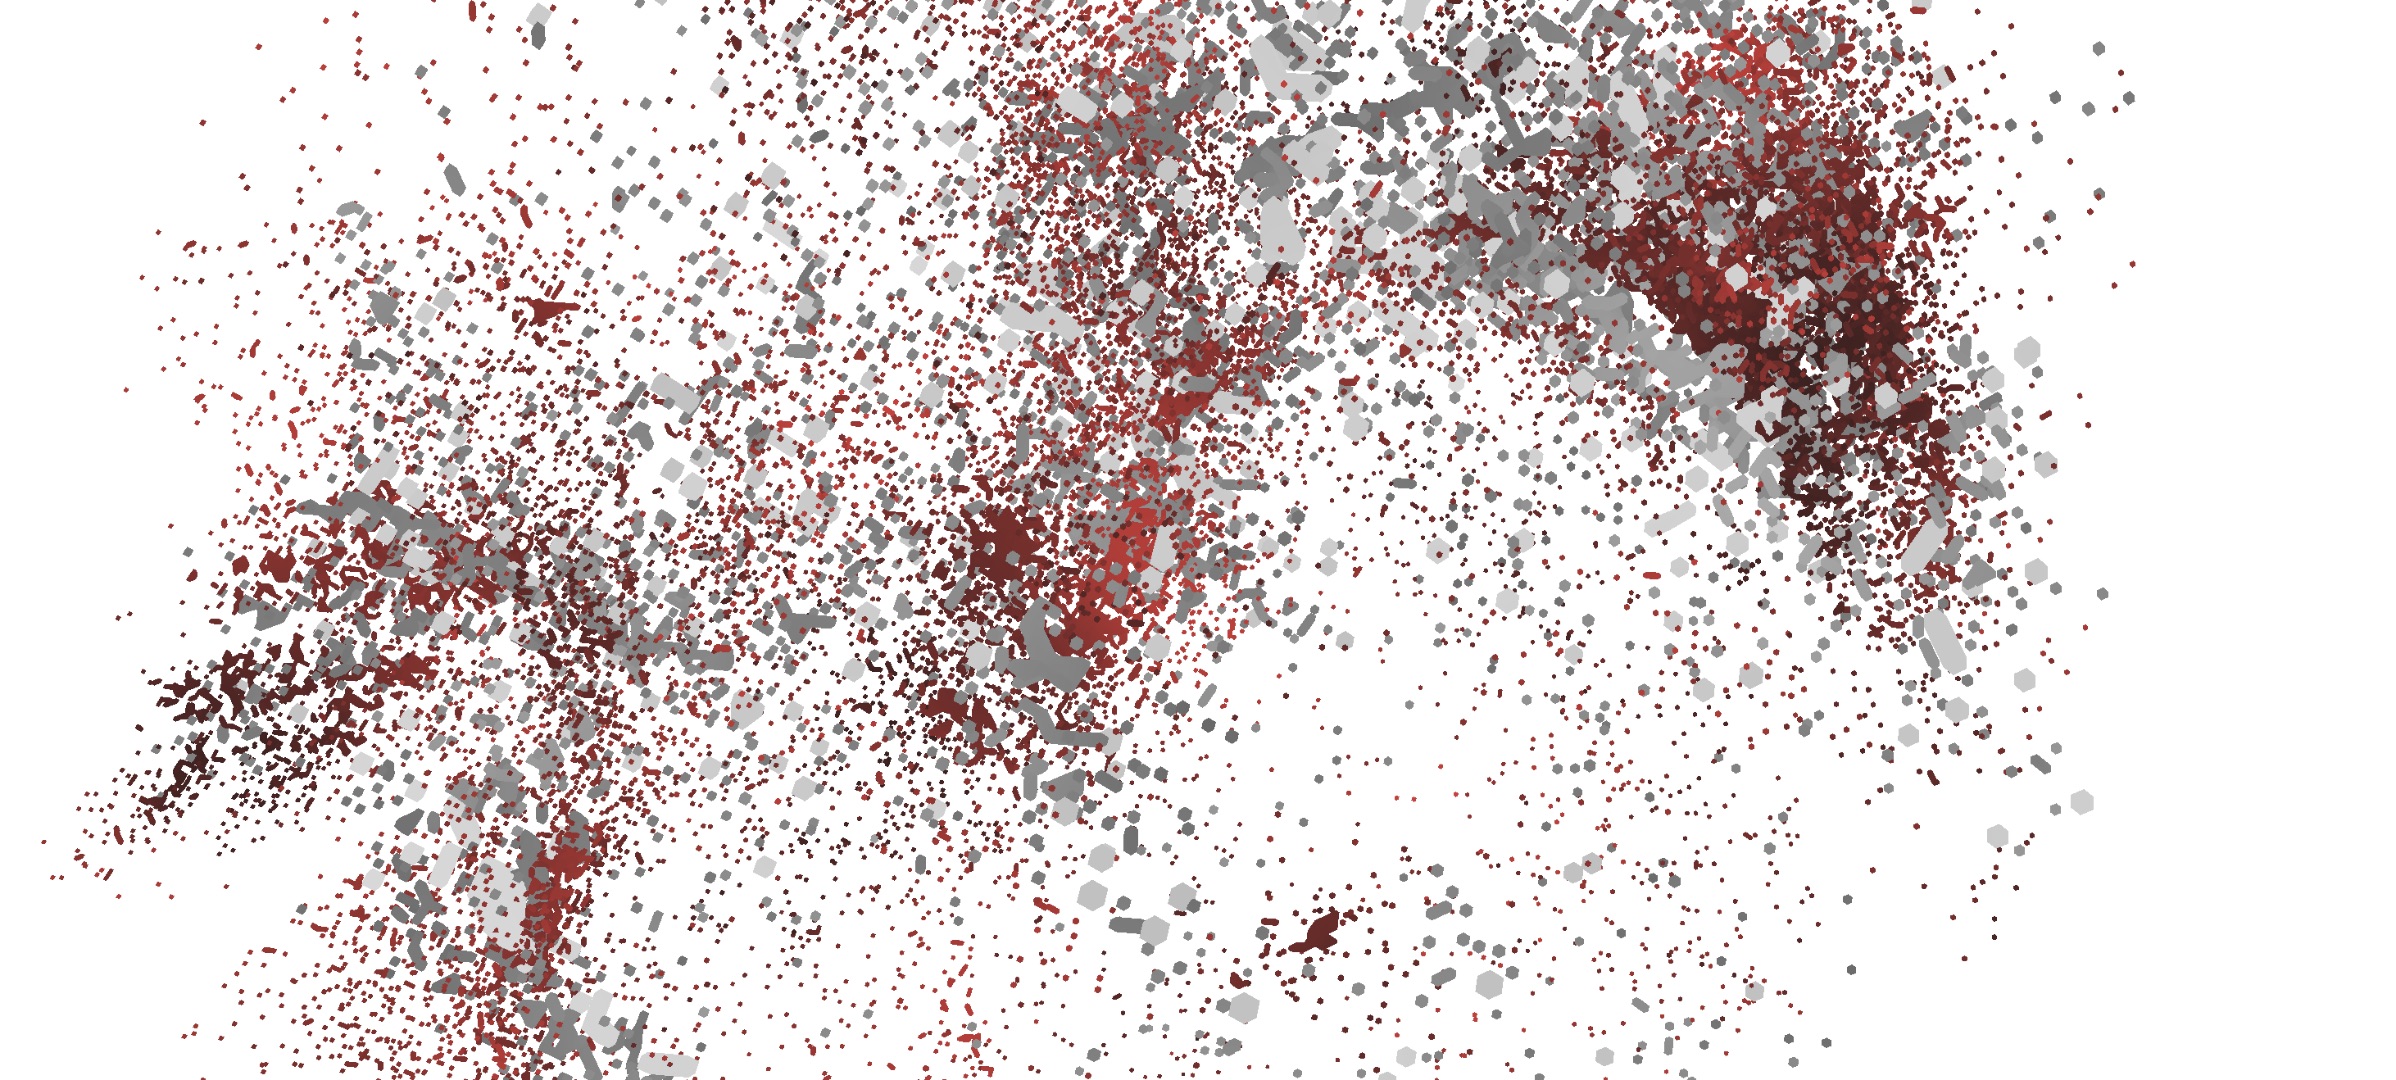
Unwelcome Gaze is a triptych visualizing the publicly reachable web server infrastructure of these companies and the routing graph(s) leading to them. Over many weeks of meticulous network reconnaissance, the routing information has been gathered and persisted locally. From it, a routing graph was reconstructed for each of the three networks. Each graph was then visualized as a generative three-dimensional sculpture, constantly shifting its appearance – just like the data it portrays.
Even though Nmap nmap.org is a state-of-the-art tool for gathering network topology information, its description of these complex structures is not absolute. Due to inherent limitations of the graph traversal algorithm and the active tracing protections deployed by some of the network providers, data is sometimes incomplete and approximated This is just a first-hand example of the impossibility of total system perception, a topic I wrote about previously. . Unwelcome Gaze embraces these imperfections and attempts to paint a cumulative, aggregated picture of the network’s complexities. The details are there, but deducing their relationship to the overarching structure is intentionally troubled.
The end goal is to help you create a sense of these networks, not visualize them absolutely.
Technical implementation
Each of these three companies has a publicly available list of IP subnets it owns. Network reconnaissance was performed using Nmap’s traceroute scan mode and stored locally as a series of XML files. Due to the extremely large graph traversal space for these subnets, the scans were broken down according to subnet size and orchestrated to run slowly across a couple of weeks’ time, in order to reduce scan aggression. Very large subnets were reduced to a more manageable size, thus leaving certain network regions unscanned. This was intentional, as the goal of this project is not total perception – which is impossible – but rather creating a sensory experience around each network’s shape and structure.
The tech stack consists of:
- Clojure
- Custom transducer-based library for parallel compute graph processing
- Custom computational geometry toolkit
- OpenGL
In a time of ever-increasing computational complexities, it is important to foster awareness of these invisible mechanisms. Many of them will forever remain hidden, but visualizing the ones which can be at least partially unobscured increases our consciousness of their presence. Where there is one, there are many.