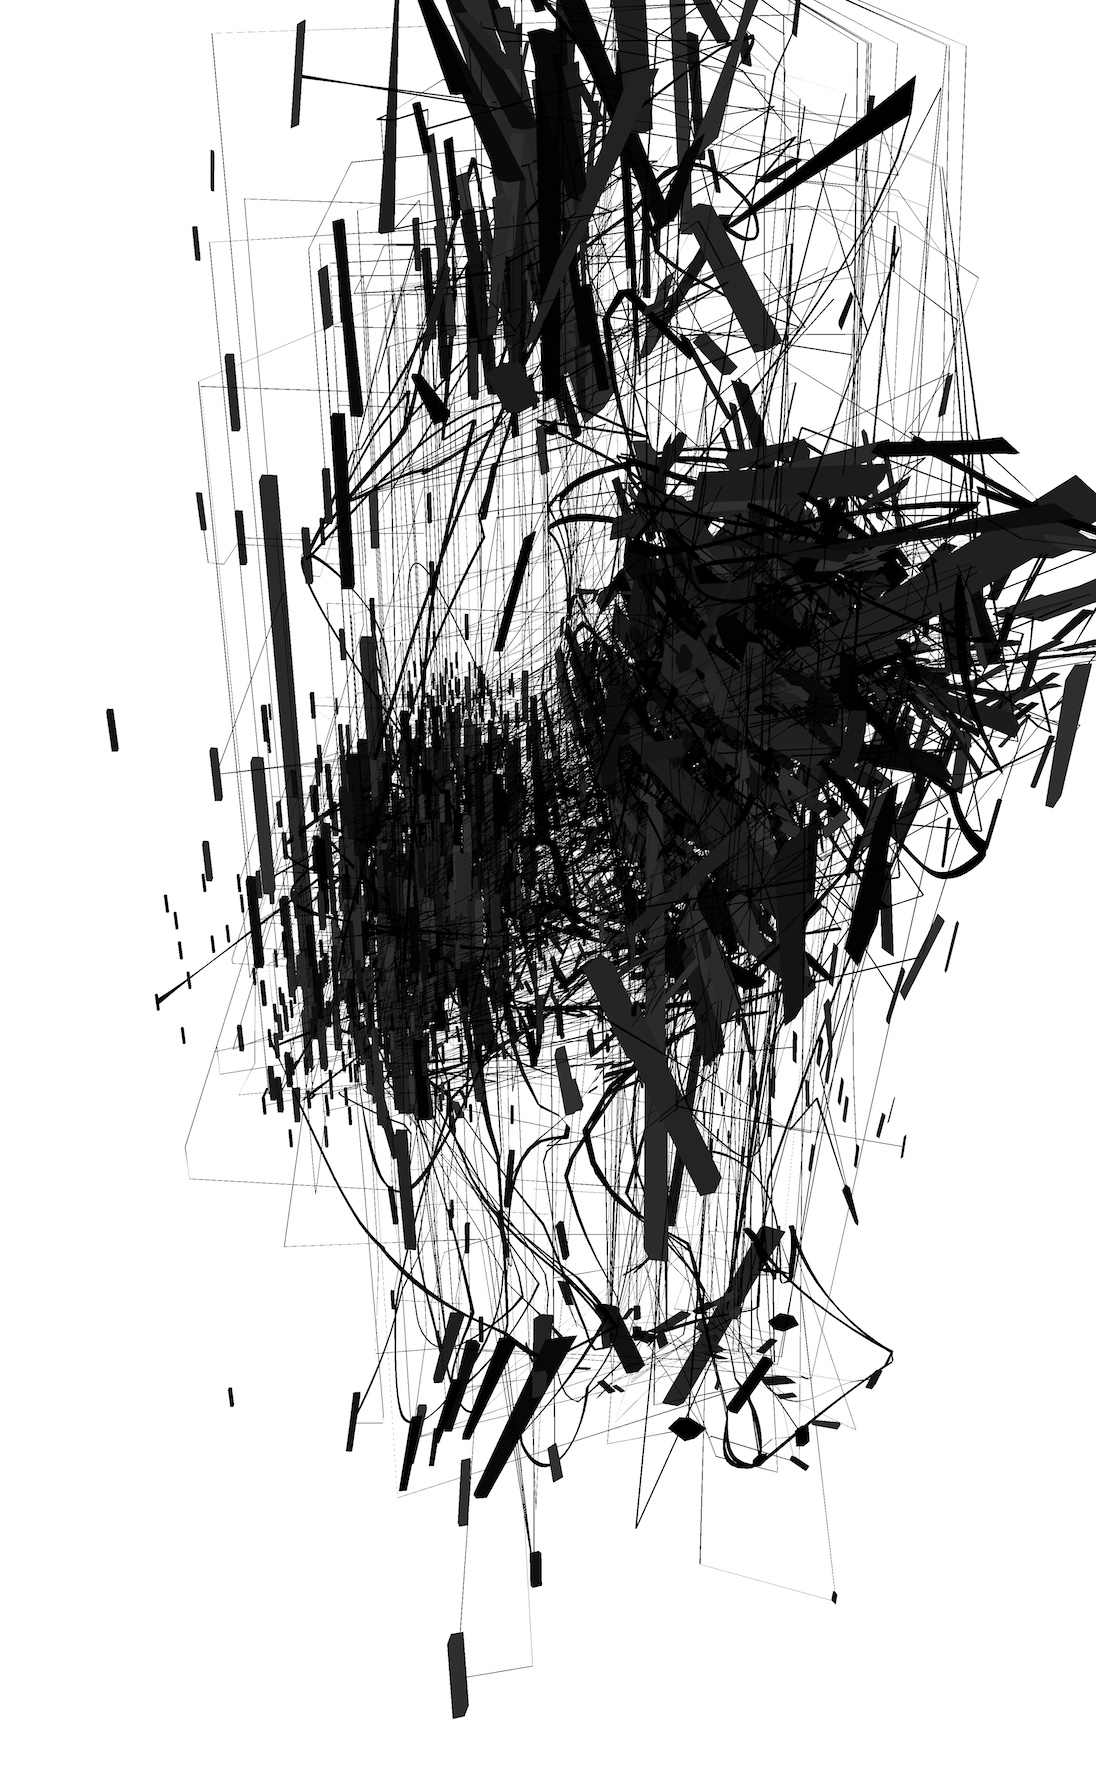
I did a preliminary traceroute scan of all IP ranges belonging to Amazon Web Services (AWS) and am experimenting with visualization styles. I had to significantly narrow the ranges for each subnet, lest my scans take weeks to complete. Currently I’m working with a neat subset containing around 2500 network nodes, while a fuller scan is currently running in the background, limited to the /24 and smaller subnets. I’m aiming for somewhere around 10k nodes to work with as a final dataset.
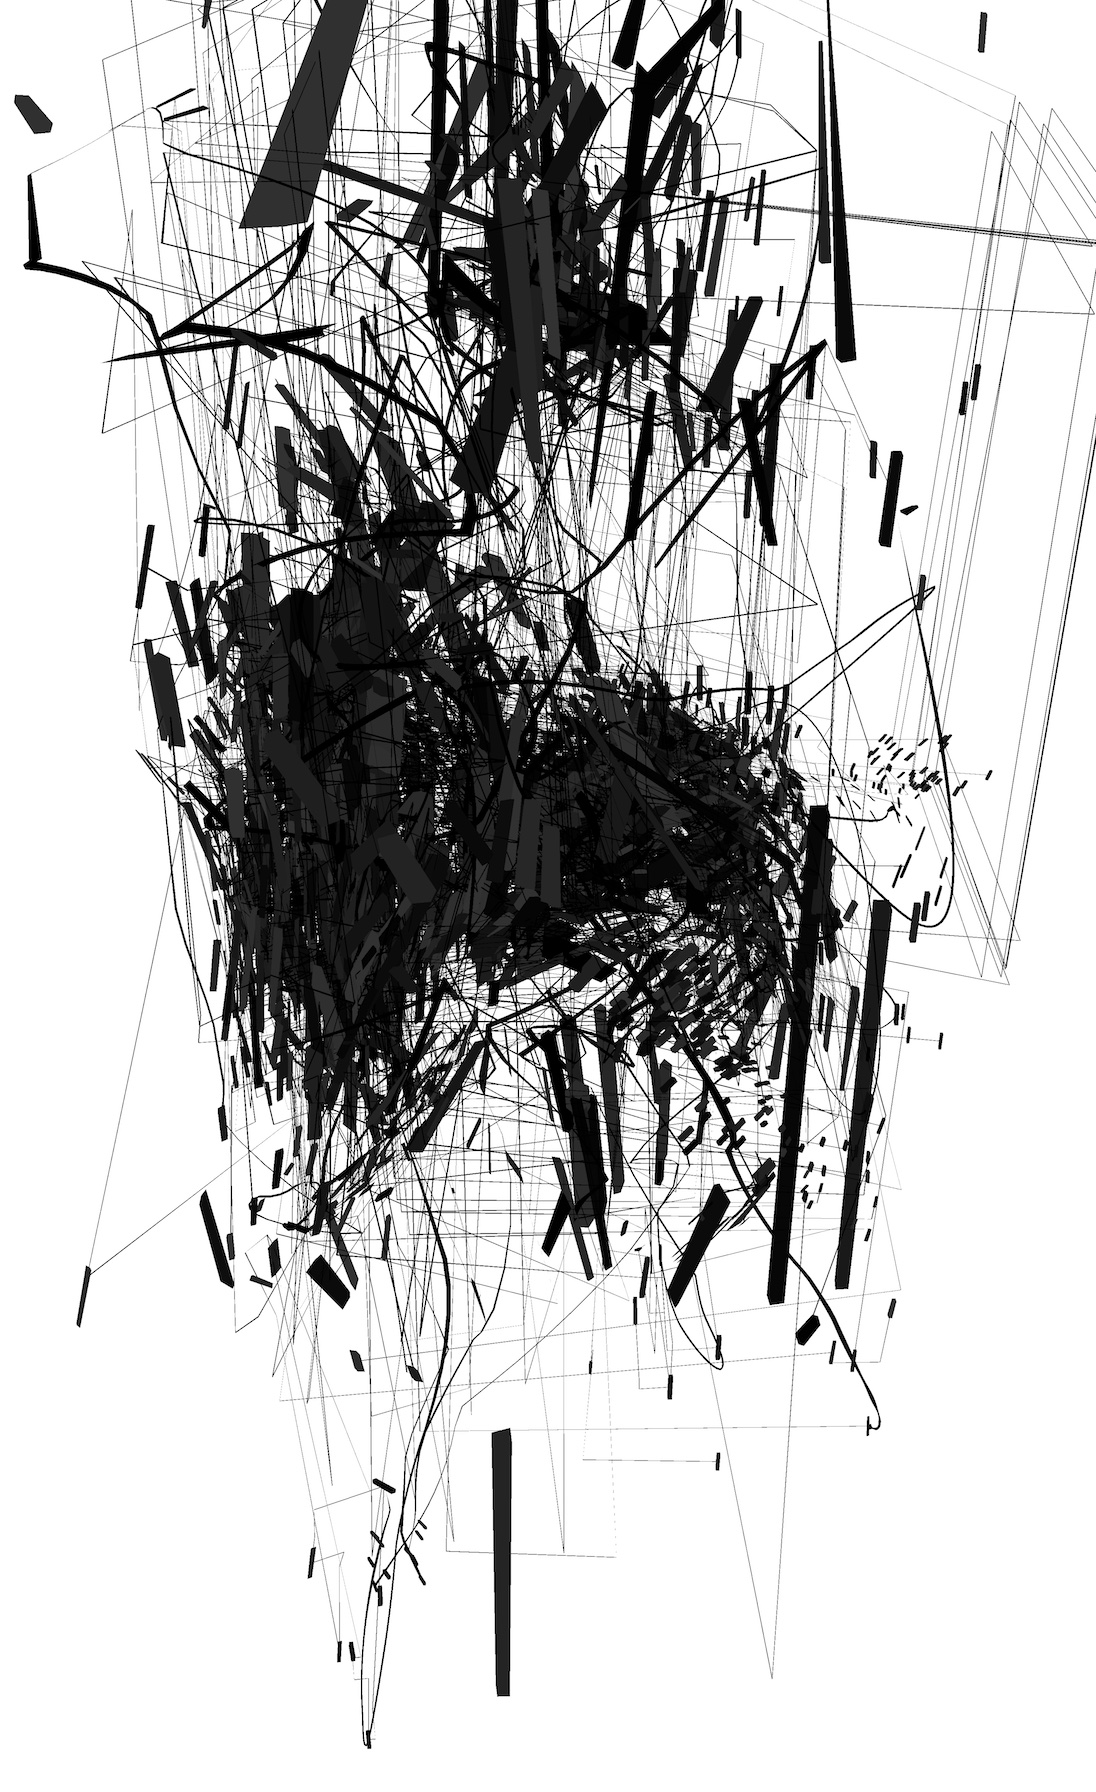
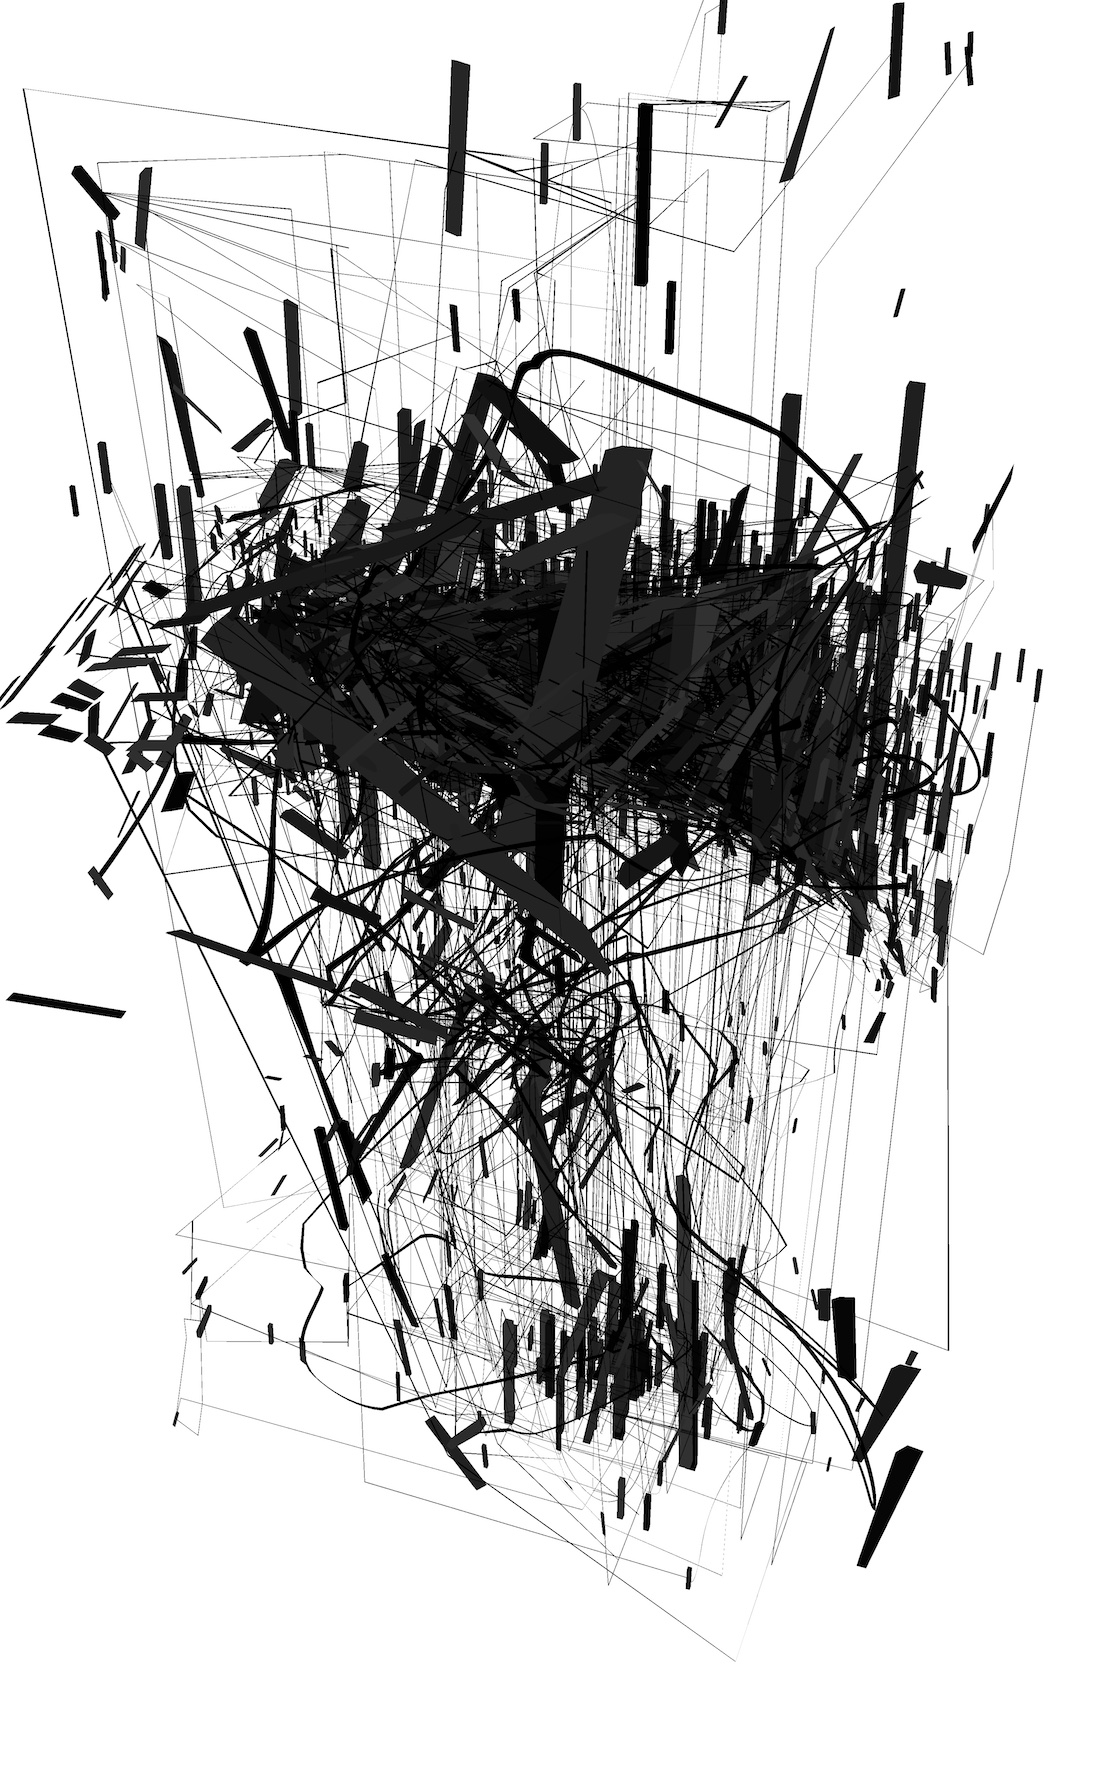
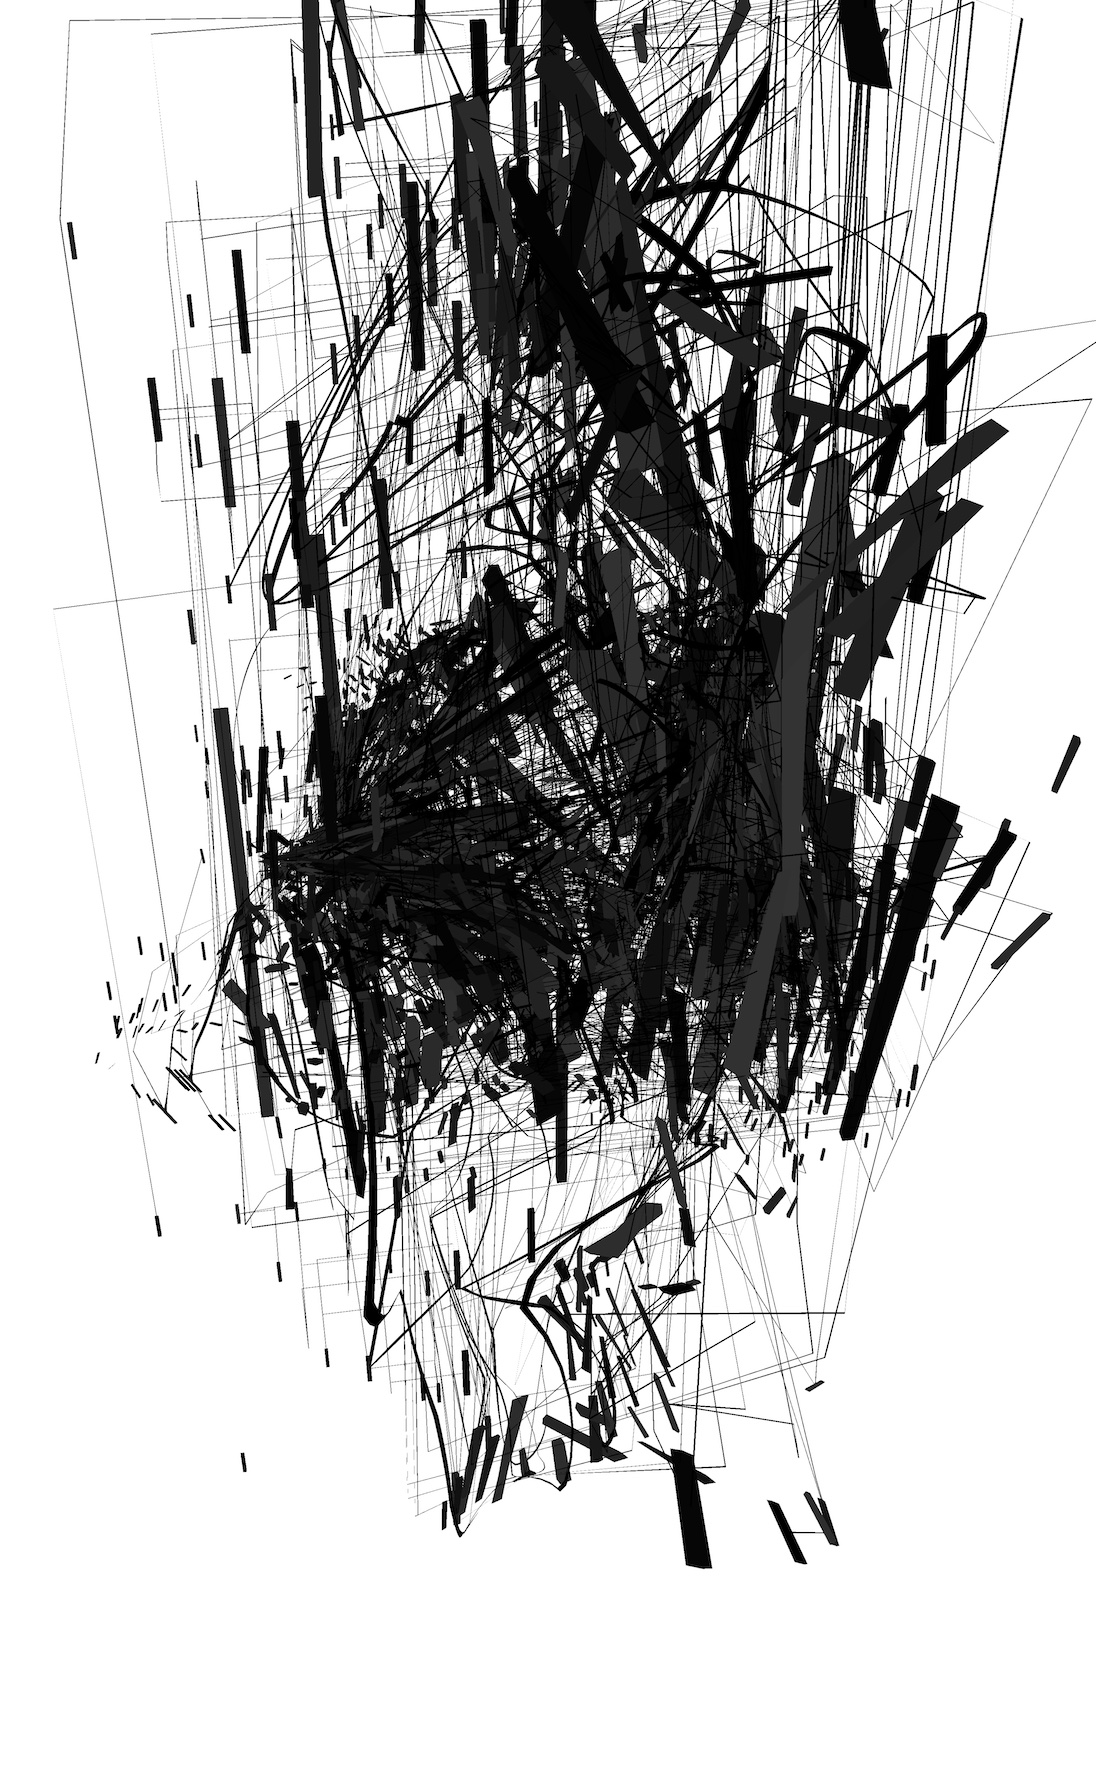
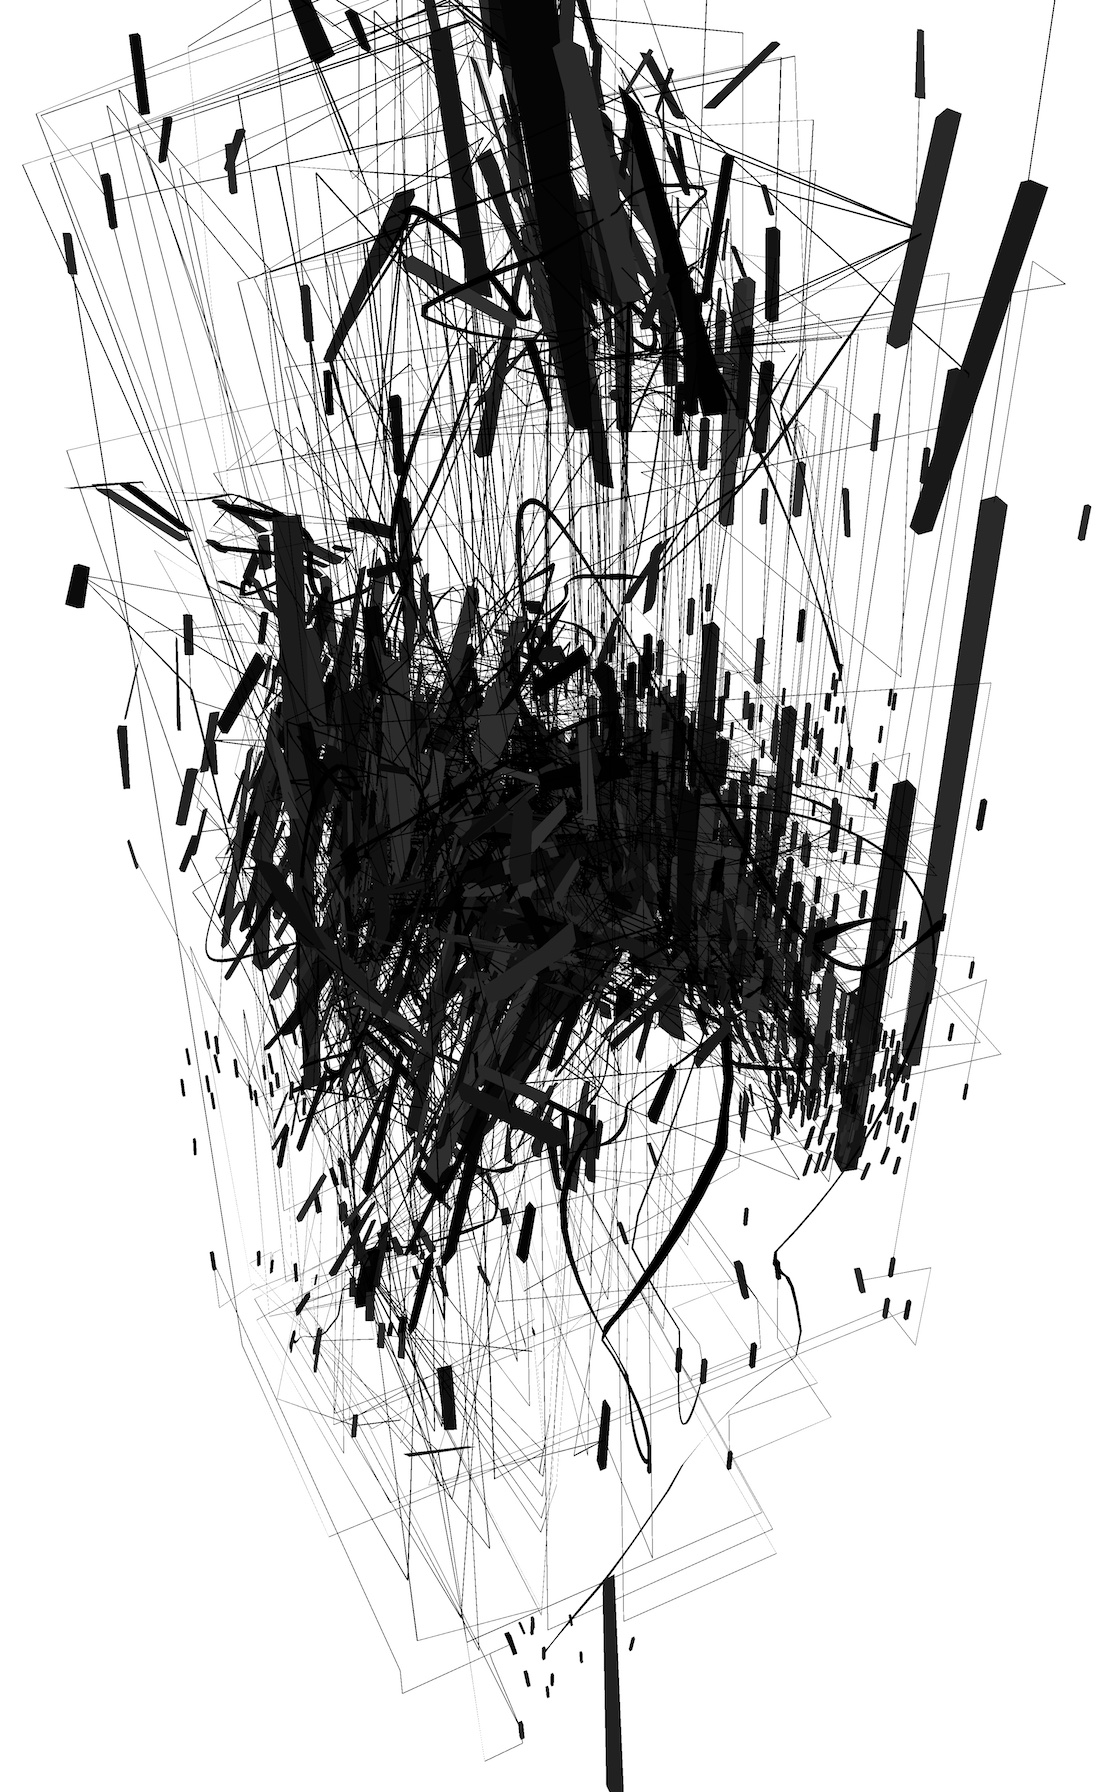
Thick lines (actually cuboids and frustums in 3D) represent network nodes, with the overall size proportional to the number of edges the node has in the routing graph. Thin lines represent a subset of actual connections between nodes.
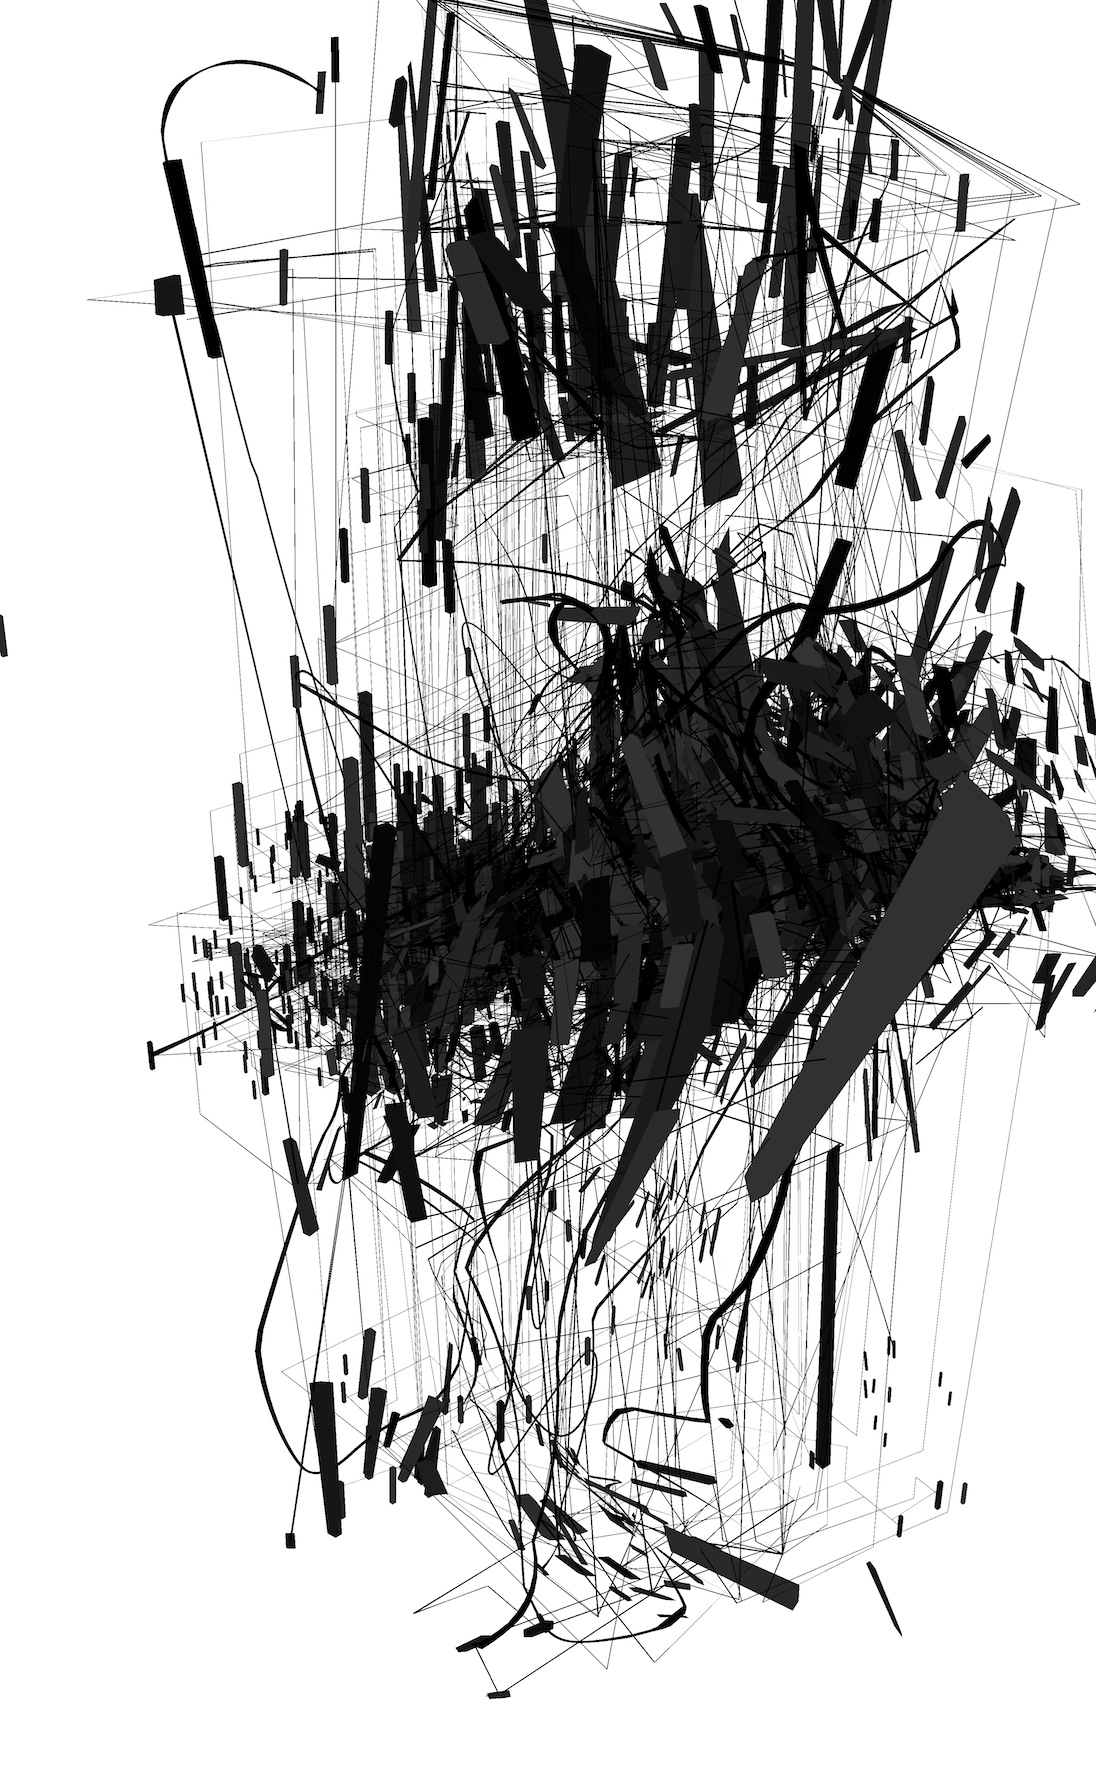
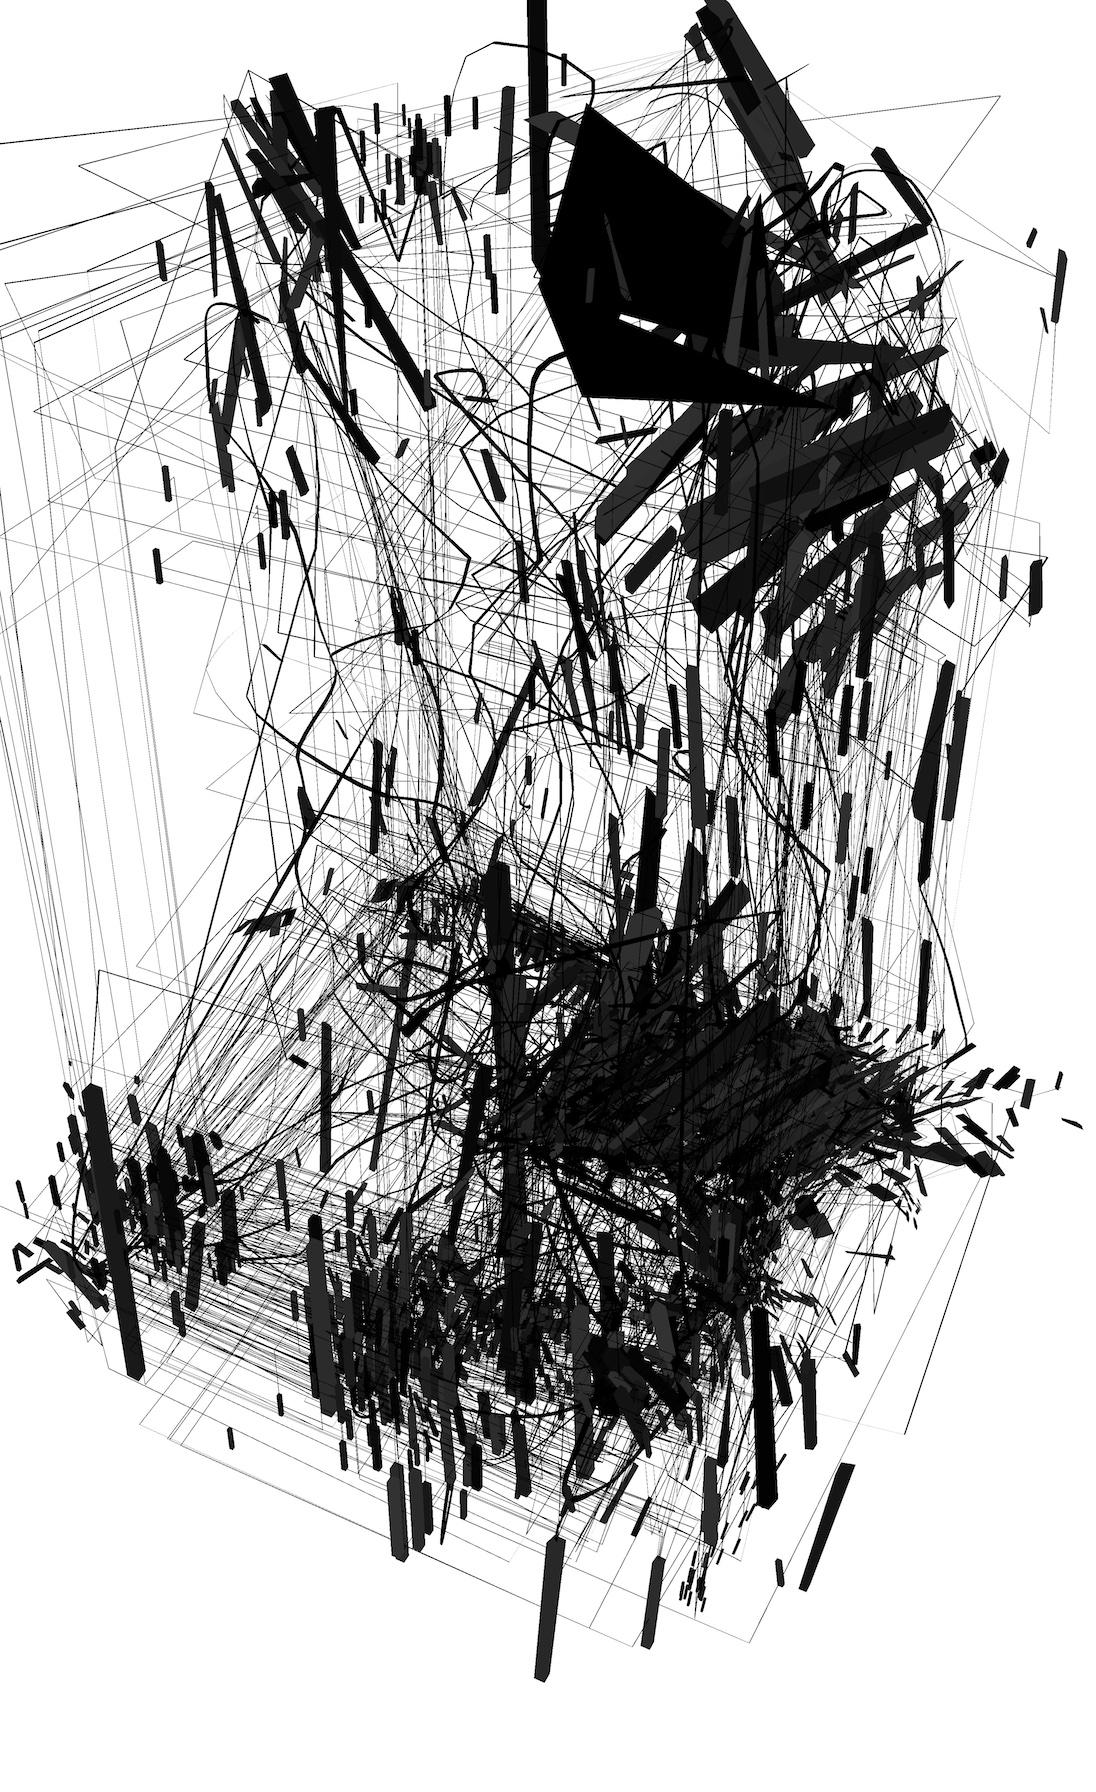
I started doing all my early visual explorations in black and white. This helps establish the composition and value balance before I jump into the color palette rabbit hole. I’ve actually been learning a lot from FZD School’s digital painting courses on YouTube. The same basic principles apply in all visual work, and I find it enlightening to learn about these fundamentals.
With this, the second piece of the triptych is nearing completion.